What’s the easiest way to analyze Pipedrive’s CRM system data with Microsoft’s Power BI reporting tool?
This article reviews the steps and bottlenecks in the reporting process for a team or small business. I will also tell you what kinds of companies each option is best for.
I’ll also shown you an example of how to create your first Power BI report.
Pipedrive’s built-in reports
The easiest option for visualizing customer data is to take advantage of Pipedrive’s built-in reports.
The CRM’s own reports are intended for simple use cases, so for more demanding analytic needs, it makes sense to use a separate reporting tool such as Power BI.
Generating Power BI reports from Pipedrive data
Power BI reports are created on your own computer with Power BI Desktop. With the free version, sharing options are limited: you can share a report file with others to open in Power BI Desktop, or you can create a PDF file of your reports to e-mail, for example.
Sharing interactive reports in Power BI inside or outside your organization requires that everyone has a Power BI Pro license. At the time of writing, Power BI Pro costs 8.40 euros per month per user.
The first and, in my opinion, most important question from the perspective of team and business processes is how to get the data downloaded to your own computer with as little effort as possible and the data updated at regular intervals. Namely, there is no ready-made connection to Pipedrive in Power BI.
Next, let’s look at options for downloading data to your own computer to generate Power BI reports.
Option 1: Download data as Excel files from Pipedrive
This is by far the easiest way for anyone to get started. It’s also suitable for reporting a limited number of tasks.
Log in to Pipedrive and go to ‘Export Data’ from the three points on the vertical navigation bar. Sales, organizations, people, and activities need to be downloaded as their own files.
This is a suitable solution if you don’t make reports very often, for example once a month. Over the long run, manually loading data once a week will become a hassle.
From this link you can download your Pipedrive data.
Option 2: Automate the download via the Pipedrive API
The data can also be accessed via the Pipedrive API, which is the programming interface. To do this, you need your personal API from your settings.
Here you can try the API on the Pipedrive developer site. Be careful as all commands will be made to your actual Pipedrive account! Also, do not give your API identity number to anyone.
As an experiment, I made a small snippet of code that can be used to download all sales to a file on my own computer. With small changes, the program could add e-mail conversations related to the transactions to the data and convert the files for a Power BI report. My own example is based on Javascript code running in a browser, which eliminates the need to install new software on your computer.
Why not then read the data with Power BI directly from the Pipedrive interface? One reason is that, due to the the interface, the data must be read in no more than 500-line snippets. In this case, the programming would in any case have to be built in Power BI with its own M programming language.
I think it’s clearest to keep data retrieval and Power BI visualizations separate. In my opinion, Power BI is good specifically for visualization, but there are better tools for data processing.
Option 3: Automate downloading with an online service
There are also ready-made services that utilize Pipedrive’s interface for downloading data. For example, Flatly can schedule the delivery of fresh Pipedrive data in files to the OneDrive folder on a daily basis.
This allows Power BI to read data straight from OneDrive.
Flatly costs a minimum of USD 50 per month. The price is competitive if your reporting process is sufficiently well-established and the automation will provide clear benefits in terms of time management.
Option 4: Export Pipedrive data to a cloud-based data center
Data can also be prepared for reporting with cloud-based tools.
For example, Stitch, Panoply, and Skyvia, based on the SaaS model, make it relatively easy to export and update data to a desired database or file location. In this case, Power BI can be easily connected to that data source using the built-in features.
Pricing for these online services starts in the range of USD 100–200 per month, so not exactly cheap. From the point of view of data security, you should also consider adding one data processor.
SaaS-based reporting services also basically fall into this category. An example of this is Databox. You can connect data from different sources to Databox with ready-made connections; additionally, reports are built on a browser-based system with Databox’s own tool.
Getting started with Databox is easy, but the functionality may be limited. The advantage is connectability to many well-known online services. Because reporting takes place in the cloud in this scenario, there is no need for Power BI in the first place.
Generating Power BI reports from Pipedrive data
Once the Pipedrive data has been downloaded to a computer in a suitable format, it should be relatively simple to make your first reports. In my example, I use sales data from Excel in line with option 1 above.
Open Power BI.
From the next menu, the data is loaded into Power BI from an Excel file.
Sometimes you need to edit the data, such as changing the text field data type to a number, creating a new column, or deleting rows under certain conditions. This all happens in the “Transform data” option in the top menu.
In the editor, it’s also possible to combine sales and organization data downloaded in separate Excel files.
You can exit the edit view by clicking ‘Close and Apply’ in the upper left corner. Finally, let’s make our first Power BI visualization.
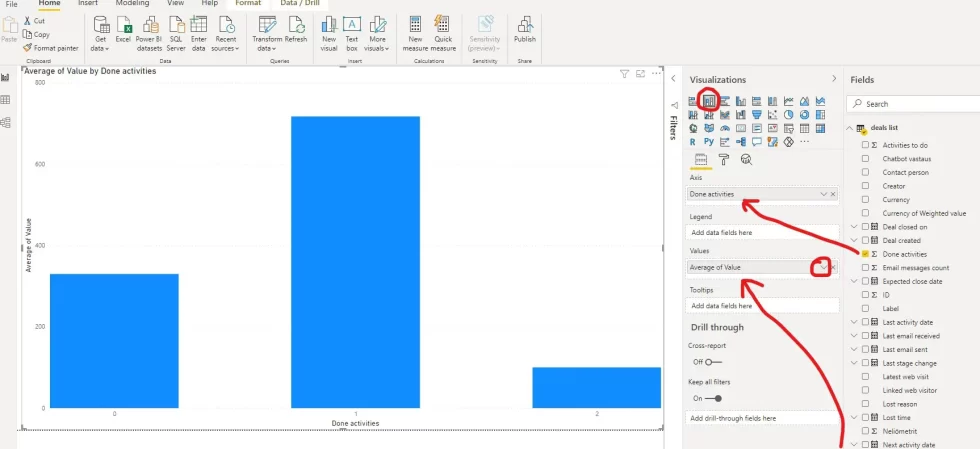
When you return to the report view, click the bar chart visualization. In this example, for the ‘axis’ I chose the number of done activities per transaction and, for ‘values’ I chose the value of the sale. From the small drop-down arrow, I changed the calculation from a sum to an average.
At least with this demo account data, a higher number of activities wouldn’t seem to lead to more valuable sales.
Power BI reports are created in much the same way as Pivot tables in Excel. You choose the numeric field and the factors according to which the data is grouped.
Summary of Pipedrive data reporting with Power BI
It is likely that different reporting needs will come up when you present the first results to others.
If Power BI’s data models start becoming chaotic, it’s worth rethinking the big picture.
A reporting solution that’s turned messy usually speaks to data utilization problems outside of reporting. On a small scale, this means that more data processing and structuring should take place before the data is imported into Power BI.
The rationale for this is that tools should be used for what they’re good at. Power BI’s strength is its ability to create visual reports with little effort.
On a larger scale, it’s a question of a company’s ability to utilize data holistically and, for example, make the necessary investments in processes and so-called data infrastructure.
The original investment in data can require a lot of work and the benefits may not be immediately clear. However, a solid foundation enables high-quality and quickly adaptable reporting at the end of the process.


